3 Graphs That Prove Home Prices Aren’t Falling
Some of your clients are probably a little freaked out about home prices, and guess what? We have the media to thank for that. Over the past year, there’s been a bunch of buzz saying home prices were about to come crashing down. And let’s be real, that kind of talk is going to spark fear.
But here’s the deal: it’s your job to cut through that noise and share the real story. Here’s what you need to know to confidently explain what’s really happening with home prices today.
Data shows home prices are not falling
Late last year, some housing experts projected a 2023 crash in home prices. The media hyped up these forecasts with doom and gloom headlines.
This made some people put their plans to move on hold for fear home values would come tumbling down like they did in 2008. It’s your job to use data and visuals to show them that didn’t actually happen.
Let’s clear the air and get to the facts. Despite the media’s stormy predictions, home prices didn’t crash – not even close. The real data tells a different story.
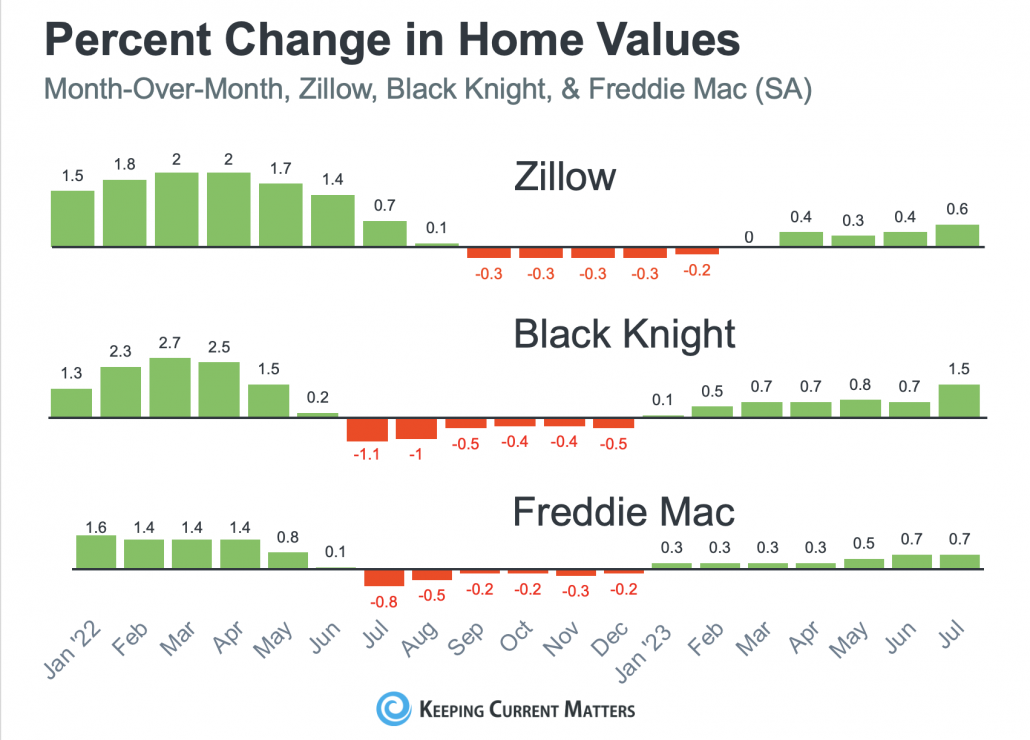
Take a look at this graph showing three trusted sources, and you’ll see that prices bounced back quickly after experiencing only minor declines last year (see graph below):
This proves the declines we did see weren’t dramatic but were short-lived. As Nicole Friedman, a reporter at the Wall Street Journal, explains it:
“Home prices aren’t falling anymore. . . the residential real-estate downturn is turning out to be shorter and shallower than many housing economists expected. . .”
Basically, the worst home price declines are behind us. Nationally, home prices have rebounded and are still rising.
The slow return to seasonal normality
Now that you have the tools to show your clients what’s happened so far this year, ease their fears even more by giving them an idea of what to expect next.
Home prices follow a predictable seasonal trend and that trend is what’s starting to happen this year.
Just like the changing of the seasons, the housing market has its own cycles. To get a clear picture of what’s normal for the market, let’s go back in time for a moment.
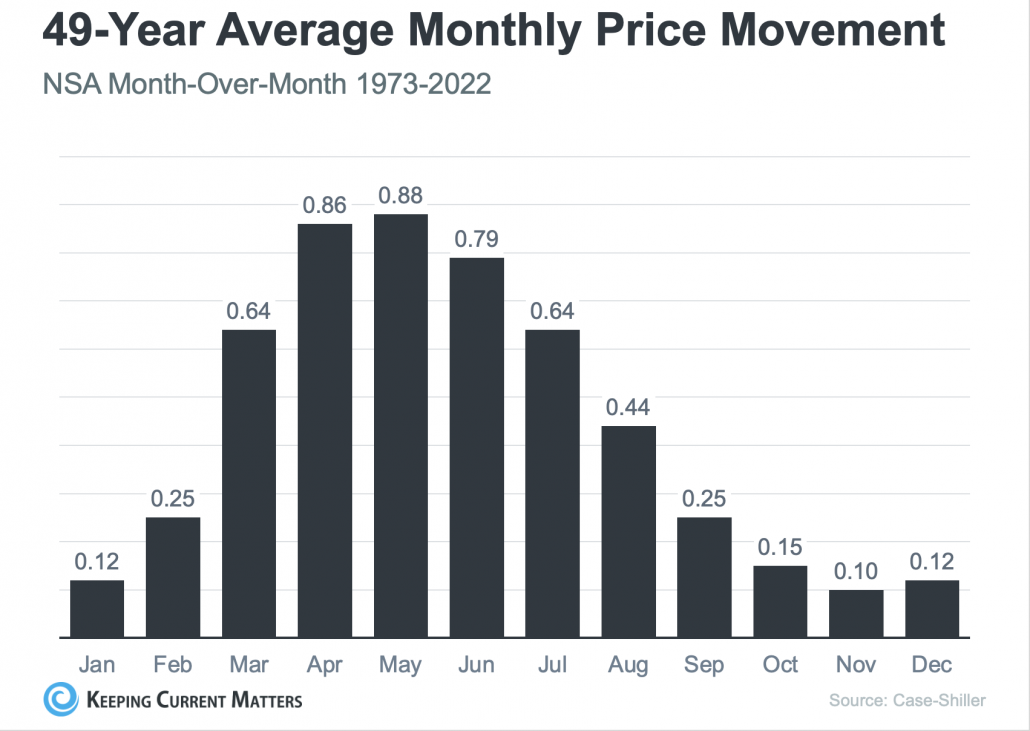
Check out the graph below – it’s based on Case-Shiller data from 1973 to 2022 (unadjusted for seasonality). It’ll help you explain how home prices usually change throughout the year:
At the beginning of the year, home prices grow, but not as much as they do in the spring and summer markets. That’s because the market is less active in January and February since fewer people move at that time of year.
As the market transitions into the peak homebuying season in the spring, activity ramps up, and home prices go up a lot more in response. Then, as fall and winter approach, activity eases again. Price growth slows, but still typically appreciates. That’s what we’re starting to see – deceleration of appreciation, not depreciation.
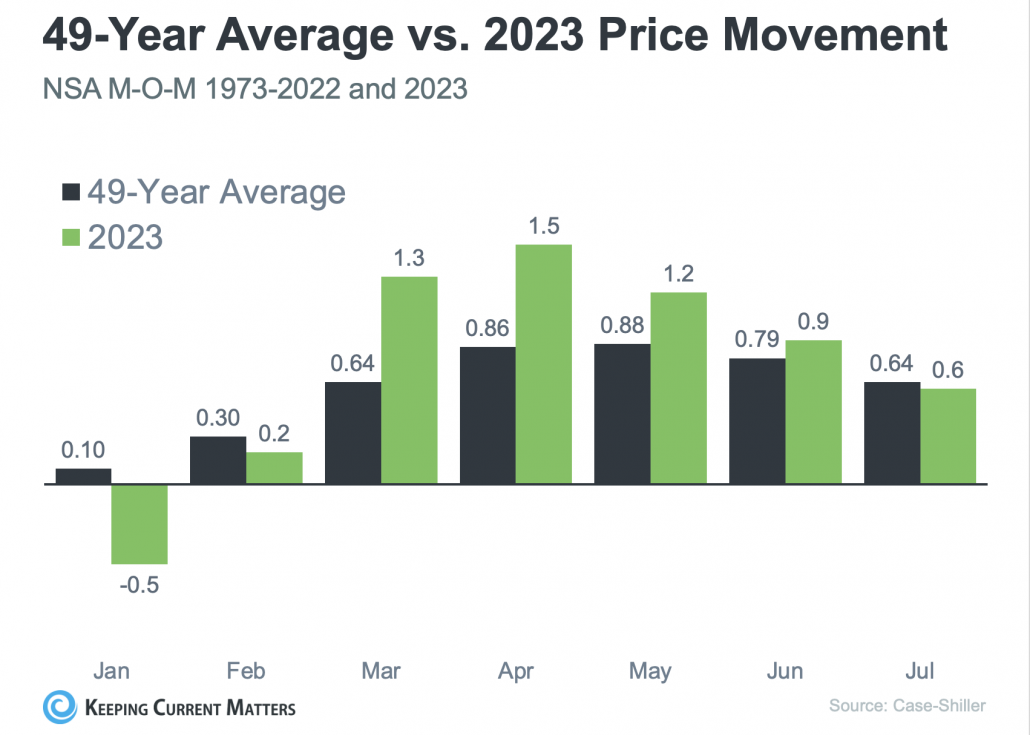
Now, look at this next graph. It takes the graph from above on the long-term trend and adds in the latest numbers available for this year. That way it’s even easier to tell the story. The black bars represent the average home price movement over 49 years, while the green bars show what’s happening this year:
Prices are still going up, just a bit slower. Sometimes the media gets it wrong, thinking slower growth means prices are dropping.
That’s not true – it’s just that appreciation is happening at a more typical pace. Explain this to your clients now to get ahead of the next round of confusing headlines.
Bottom Line
Armed with this valuable information, you have the power to reassure your clients. You can be the steady hand that guides them through these uncertain times. Share the facts, show them the visuals, and let them know that the sky isn’t falling. The media may have stirred the pot, but you now possess the tools to tell the real story, based on data and facts – not fiction.
Let’s ensure our clients understand the true state of the housing market and move forward with confidence.
Want to take a deeper dive into why home prices aren’t falling?
Sign up for the free replay of our latest webinar, Three Keys to Eliminating Fear in Today’s Housing Market.
When you watch, you’ll discover today’s top concerns from both buyers and sellers, get the tools you need to alleviate their fears, and be ready to confidently handle questions this holiday season.
Plus you’ll get a toolkit of visuals (like above) to back up the data and insights. That way you’re always able to calm any fears and address any inquires your clients may have.


