(English) 5 Top Real Estate Stories in 2011
Disculpa, pero esta entrada está disponible sólo en Inglés Estadounidense.
We believe every family should feel confident when buying & selling a home. KCM helps real estate professionals reach these families & enables the agent to simply & effectively explain a complex housing market. Take a 14-Day Free Trial of our monthly membership to see how we can help you!
Disculpa, pero esta entrada está disponible sólo en Inglés Estadounidense.
This week we are posting the best blogs of 2011 by category. We hope you enjoy them as much as you did when we first posted them. – The KCM Crew

Disculpa, pero esta entrada está disponible sólo en Inglés Estadounidense.
Disculpa, pero esta entrada está disponible sólo en Inglés Estadounidense.
Disculpa, pero esta entrada está disponible sólo en Inglés Estadounidense.
Disculpa, pero esta entrada está disponible sólo en Inglés Estadounidense.
Disculpa, pero esta entrada está disponible sólo en Inglés Estadounidense.
Disculpa, pero esta entrada está disponible sólo en Inglés Estadounidense.
Disculpa, pero esta entrada está disponible sólo en Inglés Estadounidense.
Disculpa, pero esta entrada está disponible sólo en Inglés Estadounidense.
Disculpa, pero esta entrada está disponible sólo en Inglés Estadounidense.
Disculpa, pero esta entrada está disponible sólo en Inglés Estadounidense.

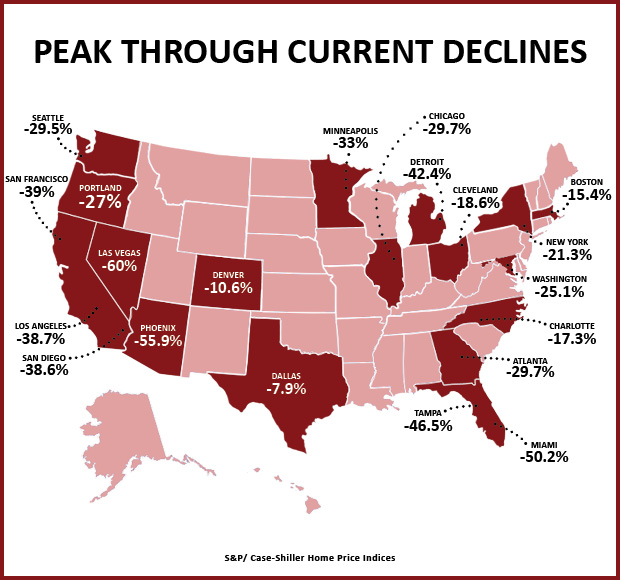
The graphic depicts pricing of all homes from their ‘peak through current declines’ as per Case Shiller. This index looks at prices in 20 major metropolitan areas.
Each market peaked at different times. Therefore, the InfoGraphic doesn’t cover one segment of time. Here is a site where you can see when each market actually peaked:
Disculpa, pero esta entrada está disponible sólo en Inglés Estadounidense.
Disculpa, pero esta entrada está disponible sólo en Inglés Estadounidense.
Disculpa, pero esta entrada está disponible sólo en Inglés Estadounidense.
Disculpa, pero esta entrada está disponible sólo en Inglés Estadounidense.

Disculpa, pero esta entrada está disponible sólo en Inglés Estadounidense.
Disculpa, pero esta entrada está disponible sólo en Inglés Estadounidense.
Disculpa, pero esta entrada está disponible sólo en Inglés Estadounidense.
Disculpa, pero esta entrada está disponible sólo en Inglés Estadounidense.
Disculpa, pero esta entrada está disponible sólo en Inglés Estadounidense.
Disculpa, pero esta entrada está disponible sólo en Inglés Estadounidense.
Disculpa, pero esta entrada está disponible sólo en Inglés Estadounidense.
