Two Graphs that Scream - List Your Home Today!

We all learned in school that when selling anything, you will get the most money if the demand for that item is high and the inventory of that item is low. It is the well-known Theory of Supply & Demand.
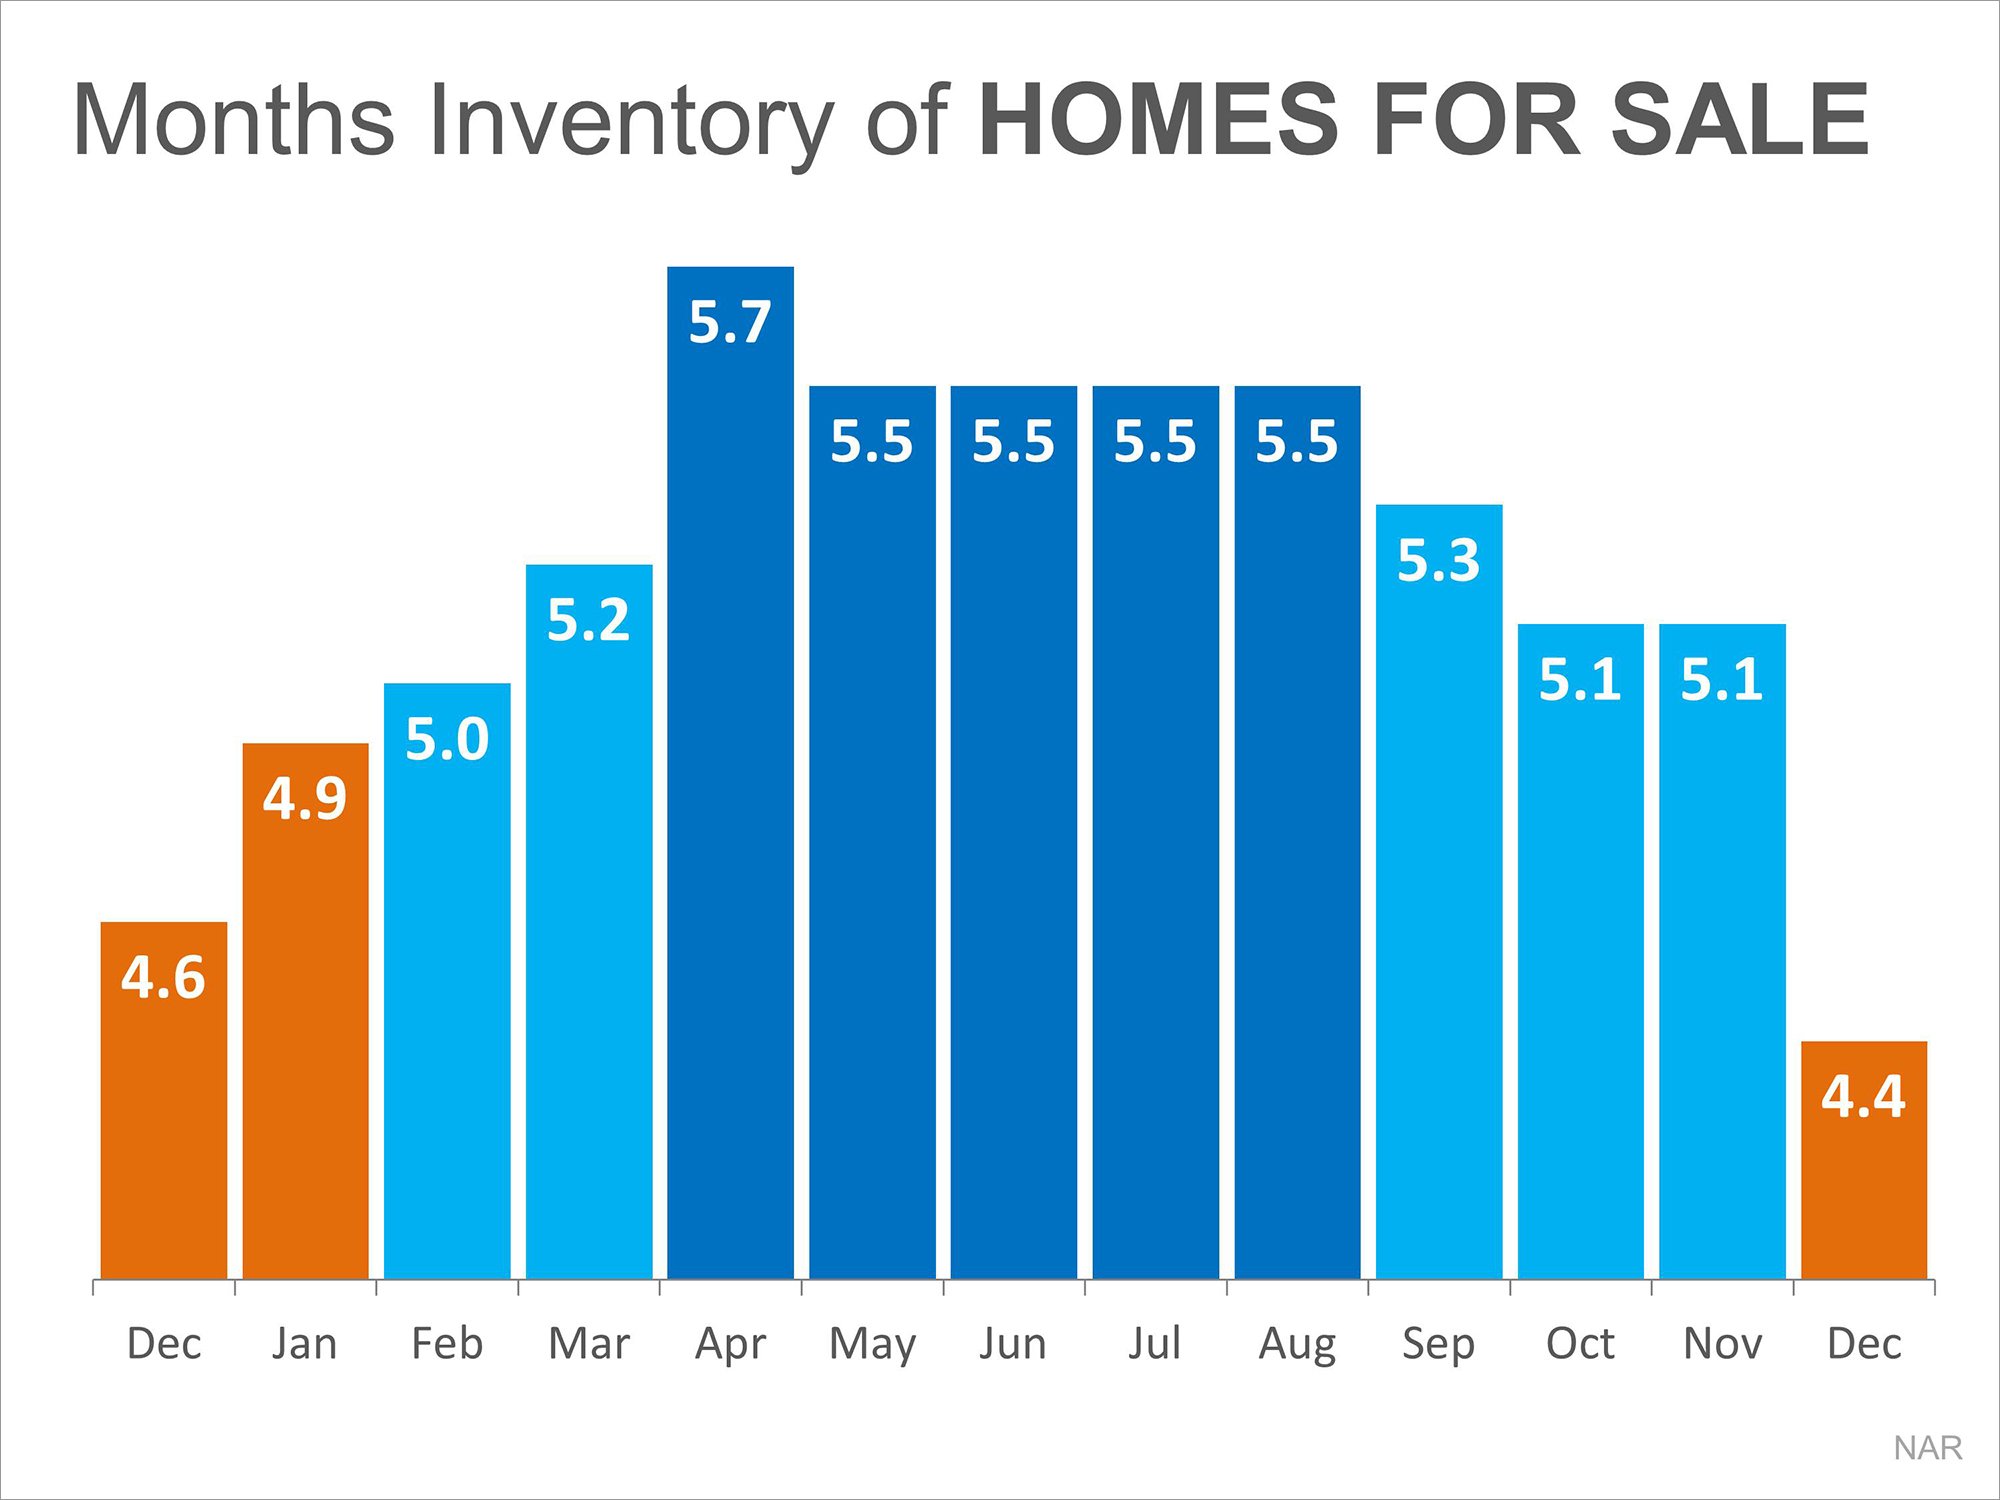
If you are thinking of selling your home, here are two graphs that strongly suggest that the time is now. Here is why…
DEMAND
According to research at the National Association of Realtors (NAR), buyer activity last month (January) was three times greater than it was last January. Purchasers who are ready, willing and able to buy are in the market at great numbers.
SUPPLY
The most recent Existing Home Sales Report from NAR revealed that the months’ supply of housing inventory had fallen to 4.4 months which is the lowest it has been in over a year.
Bottom Line
Listing your house for sale when demand is high and supply is low will guarantee the offers made will truly reflect the true value of your property.
|
Members: Sign in now to set up your Personalized Posts & start sharing today!
Not a Member Yet? Click Here to learn more about KCM’s newest feature, Personalized Posts. |


