Buyer Demand Surging as Spring Market Begins
Last fall, some predicted that the 2019 residential real estate market would be a disaster. There was even belief we might experience a housing crash like the one that occurred during the last decade.
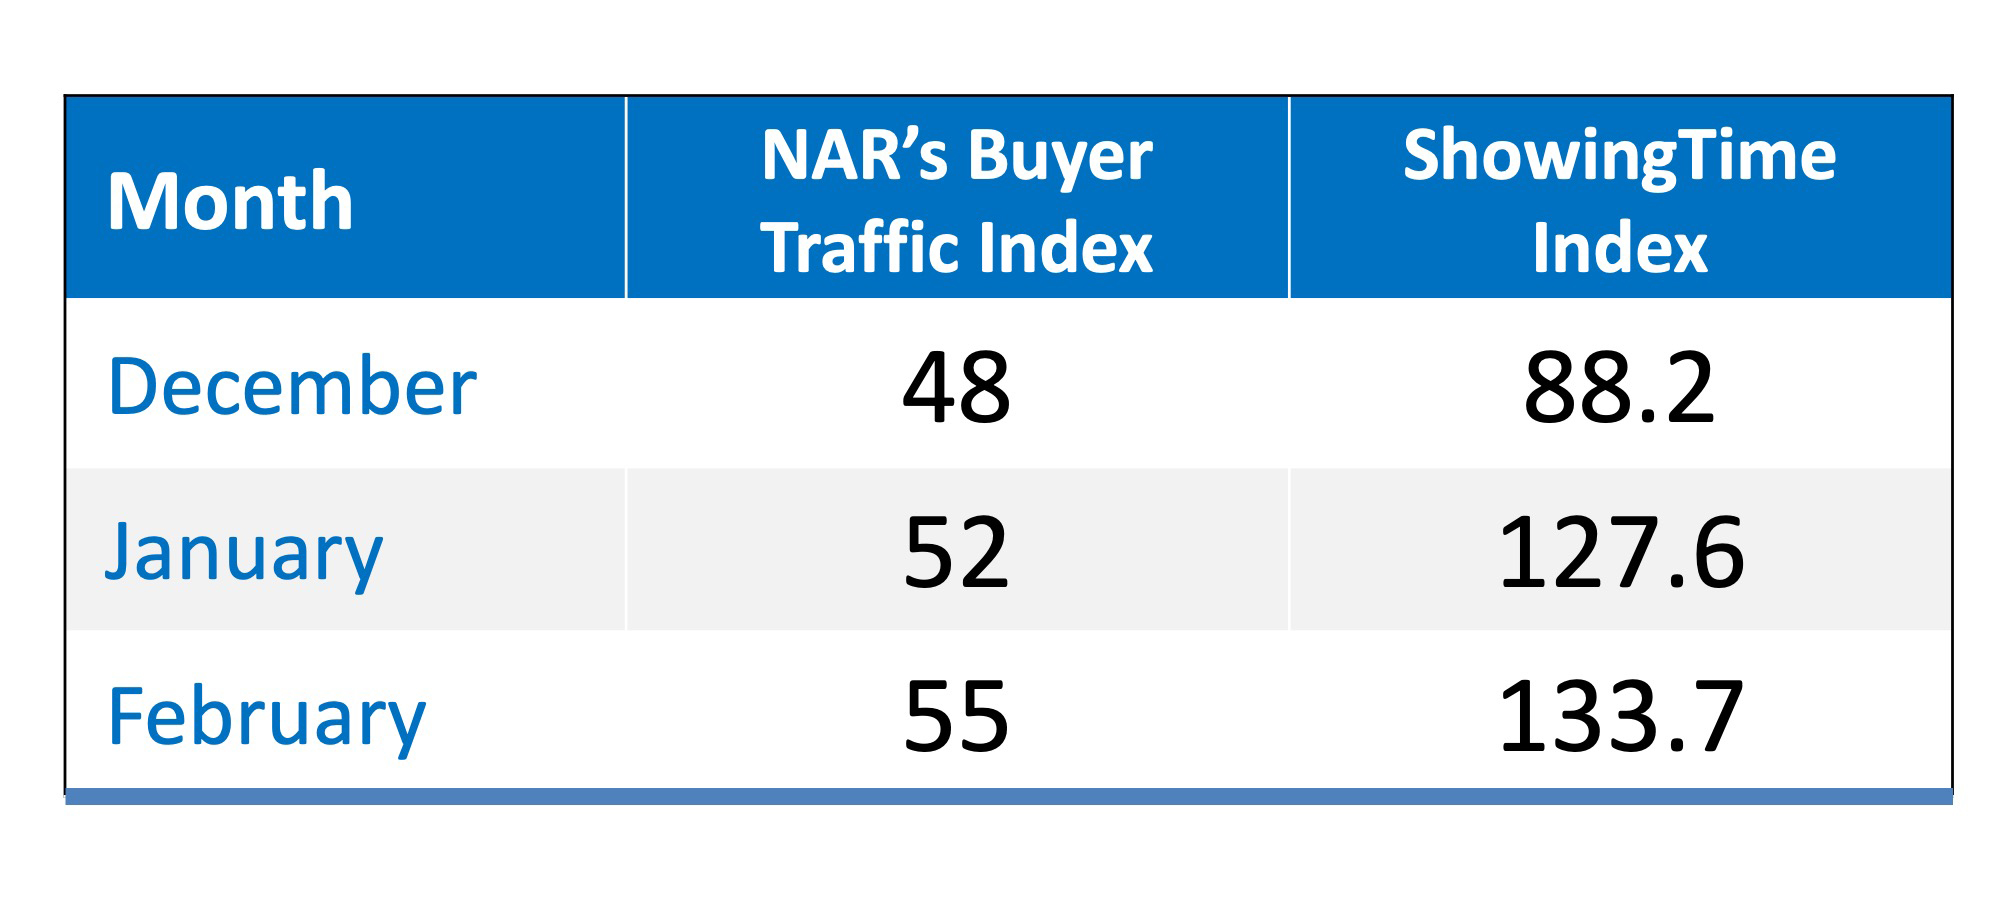
However, according to two separate reports*, buyer demand dramatically increased over the last three months, leading into this spring buyers’ market (the March data is not yet available).
Both the ShowingTime Showing Index and the National Association of REALTORS Buyer Traffic Index show that buyer demand has increased in each of the last three months.
Why the increase in demand? Increased buying power.
According to the National Association of Realtors’ Economists’ Outlook Blog, purchasing a home has become more affordable, which has led to increased demand.
“Due to the combination of falling home prices and mortgage rates, the income needed to make an affordable mortgage payment (mortgage no more than 25% of income) on a median-priced home with 10% down payment and 30-year fixed rate mortgage decreased from $60,425 in June 2018 to $53,783 as of February 2019, and the difference of $6,642 represents a gain in buying power because one can afford a home purchase at a lower level of income.”
Bottom Line
It appears the spring buyers’ market is going to be much stronger than many had projected. Whether you are selling or buying, this is important news.
*The methodology behind the indices:
The ShowingTime Showing Index
“The ShowingTime Showing Index® tracks the average number of buyer showings on active residential properties on a monthly basis, a highly reliable leading indicator of current and future demand trends.”
The National Association of REALTORS® Buyer Traffic Index
“In a monthly survey of REALTORS®, NAR asks respondents ‘Compared to the same month last year, how would you rate the past month’s traffic in neighborhood(s) or area(s) where you make most of your sales?’ NAR compiles the responses into an index, where an index above 50 indicates that more respondents reported “stronger” traffic than “weaker” traffic.”
|
Members: Sign in now to set up your Personalized Posts & start sharing today!
Not a Member Yet? Click Here to learn more about KCM’s newest feature, Personalized Posts. |


